Engineering 58 Lab 4
Kader, Luong, Piper, Mr.Dobos
22 Feb through 04 March 2005 (and beyond…)
System Identification of an Earth-bound
Satellite
Abstract
The satellite model was supplied with several inputs and the voltage response from two angled solar cells mounted on the satellite was recorded. The resulting data was fitted to different transfer functions in order to come up with an approximate model of the system without performing a complicated analysis of the physics. The transfer function obtained does not completely account for the behavior of the satellite for the various inputs, but is probably reasonable.
Inputs
To the system was applied a step input and an impulse. Ideally the impulse response would be most desirable because the impulse response is the transfer function. In the end the step response was used because of difficulties with analyzing the impulse response. The responses are shown below.
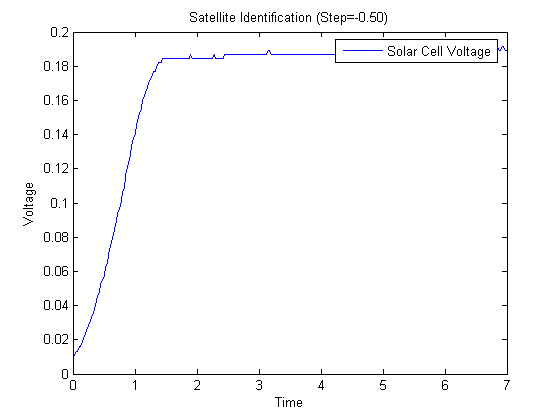
Figure 1. Step Response of Satellite
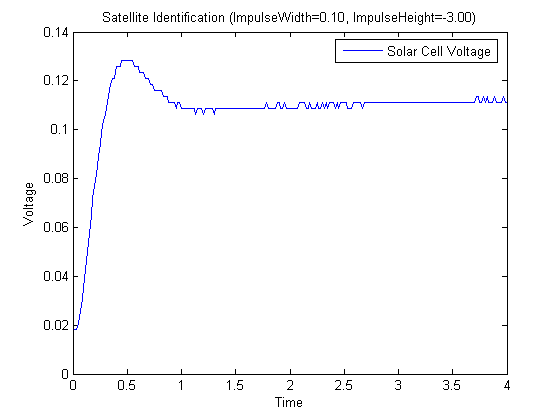
Figure 2. Impulse Response of Satellite
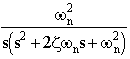
The difficulty we had was that the impulse response did not return to 0 as it should have, since no more input was being applied after the impulse. This result meant that the transfer function had a pure integrator in, and with the overshoot and oscillation would lead to a transfer function of the form
However, this could not possibly be the correct transfer function for the step response, since a step input with a pure integrator would necessarily give a ramp output, which is not the case at all. Since the satellite does not keep spinning, there cannot be a pure integrator in the transfer function.
Problems
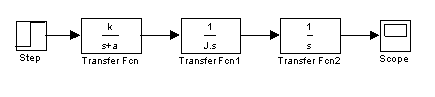
Given these contradictions we decided to use the step response. The problems with impulse response could be attributed to a non-linear Coulomb friction that keeps the satellite from returning to the zero position. We attempted to build a Simulink model to analyze the system assuming such a dry friction component. Since the angular velocity of the large flywheel changes most when the net torque is the greatest, and because the torque can be thought of as an impulse when the motor changes speed, we modeled the velocity as a simple e-t system. The output from this gives the torque, which was integrated to obtain the acceleration and then velocity of the satellite. We subtracted off a constant Coulomb friction, but using a signum(x) function to have it applied only when the velocity was greater than zero. We had much trouble simulating this system, and varying the parameters and configuration did not lead us to an appropriate model for the system. The attempted model is shown below in Figure 3a.

Figure 3a. Simulink
Model With Proposed Nonlinearities
The signum and the absolute value blocks are only there to make sure we have Coulomb friction only when the motor is spinning.
When the motor is spinning the sign is positive.
So signum( + ) = 1;
![]()
In the other cases, where we have a negative sign or 0.
signum( - ) = -1;
![]()
signum( 0 ) = 0;
![]()
So those two blocks take care of all cases.
When modeling the transfer function of the system we can consider the two cases separately.
When we have Coulomb friction, the system becomes
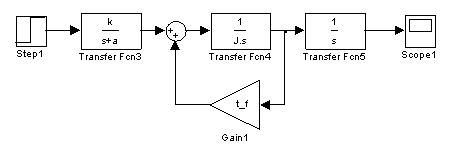
Figure 3b. Simulink
Model With Proposed Nonlinearities
![]()
![]()
![]()
When we don’t have Coulomb friction
![]()
![]()
Figure 3c. Simulink
Model With Proposed Nonlinearities
Fitting the Data
Anyways
As such we used the step response to obtain our transfer function. We used a second order double exponential transfer function, because it did not have pure integrator, and it allowed for overshoot, as we saw in the impulse response. The form of the transfer function with the step input (1/s) is
![]()
We fit the data with Kaleidoscope, and the curve fit is shown below in Figure 4. The fit equation used was


Figure 4. Curve Fit To Step Response Data
Matching the curve fit values to the general form of the transfer function, we get the satellite system’s transfer function to be
![]()
Simulating this a step response to this transfer function in MATLAB gives
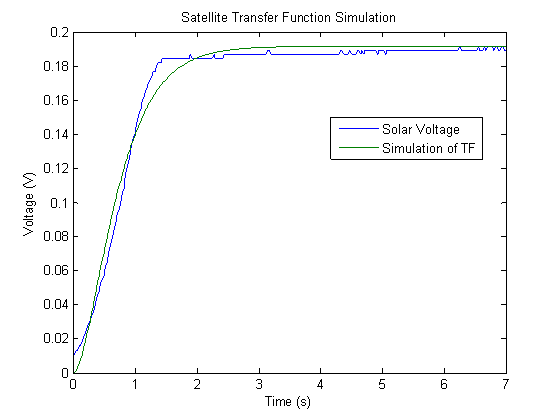
Figure 5. MATLAB Simulation Results
>>
sys = tf(1.269, [1
2.723+2.432 2.723*2.432])
Transfer
function:
1.269
---------------------
s^2
+ 5.155 s + 6.622
>>
load satellite_step_-0.50.mat
>>
[SimY, SimT] = step(sys, t);
>>
plot(t, SolarVoltage, t, SimY);
More Problems
The other difficulty possibly would be a non-linearity of the solar sensors. As the satellite rotates, the angles of the light touching each of the two solar cells changes, and one of them eventually goes dead with a large enough angular displacement. Crude testing by measuring the solar cell voltage as a function of angular displacement resulted in Figure 6, which clearly shows the nonlinearites.
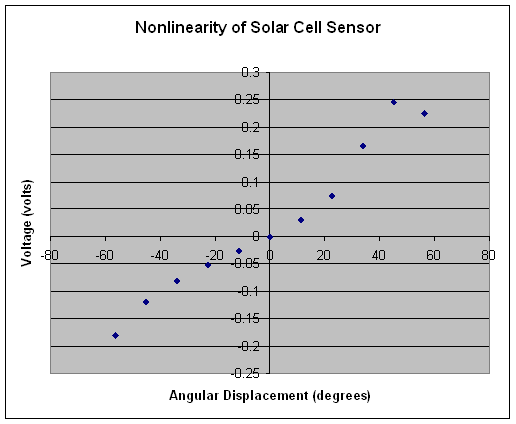
Figure 6. Nonlinearities of Solar Sensor
Attempt of the Signal Analyzer
We were able to run the signal analyzer on a simple first order low-pass filter RC circuit, and successfully obtain the transfer function. Despite our gallant efforts, we were unable to use this methodology to obtain a transfer function for the satellite system.
Controlling the Satellite in the Next Lab
Even though we didn’t arrive at good model for the satellite, we should still be able to design a controller for it in the next lab using the standard PID controller design techniques.