Beam Bending and Ski Pole Buckling Analysis
Engineering 6
Scott Fortman-Roe,
Alex Benn, Paul Agyiri, Aron Dobos
20 April 2005
Abstract
In this lab the flexural modulus for a given timber beam of timber was determined. A known force was applied to the beam at a known location, and the deflection at various points was measured. The experimental deflection data was compared to a theoretical deflection model, and the beam characteristics were thereby calculated. Using MATLAB scripts and Macauley function analysis methods, we determined the flexural modulus E to be 1504382 psi. As an extension, the buckling of a composite graphite/kevlar-epoxy ski pole was observed, and its elastic modulus was calculated to be 6685700 psi.
Introduction
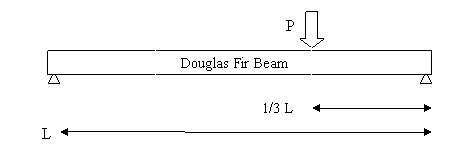
To setup the loading scenario we placed our beam--Douglas Fir, 5.25”x3.42”x100”--on two cinderblocks, one at each end. These cinderblocks can be idealized as point supports that exert no lateral forces, exerting instead only vertical forces. We then applied a load at a location 1/3 down one side of the beam. In order to apply this load we relied upon a 120kip testing machine. Which we controlled to create varying loads.
As we applied load we simultaneously measured the deflection of the beam of four different locations. These locations were at one quarter the length of the beam, one third the length of the beam (the same location load was being applied), at one half the length of the beam and then finally at three-fourths the length of the beam. We used pressure sensitive gauges--rather finicky ones in fact--to carry out these measurements for three of the locations and then the testing machine itself to measure the fourth location where pressure was being applied.
We carried out this whole process twice: once with the timber laid upright and once with it laid flat. For the upright run we stepped our load from 0lbs to 625lbs with 125lb increments. For the flat run, we stepped our load from 0lbs to 375lbs in 75lb increments.
Data
The actual collection of data itself went rather smoothly and quickly. Four people observed the measurements while one individual recorded data. We had no problems whatsoever except with the calibration of the deflection sensors. One of these sensors (the one located at ¾ the length of the beam in fact) was rather difficult to calibrate to zero load for it would move in a random direction when the calibration knob was turned. This feature of the device led to much frustration and some amusing moments, but we were ultimately successful in getting it set to zero.
|
Load (lb*ft) |
Defl @ L/4 (in) |
Defl @ L/3 (in) |
Defl @ L/2 (in) |
Defl @ 3L/4 (in) |
|
Upright (5.25d x 3.42w) |
|
|
|
|
|
0 |
0 |
0 |
0 |
0 |
|
125 |
0.031 |
0.045 |
0.038 |
0.024 |
|
250 |
0.058 |
0.083 |
0.075 |
0.048 |
|
375 |
0.086 |
0.12 |
0.111 |
0.072 |
|
500 |
0.113 |
0.156 |
0.146 |
0.095 |
|
625 |
0.141 |
0.191 |
0.182 |
0.118 |
|
Flat (3.42d x 5.25w) |
|
|
|
|
|
0 |
0 |
0 |
0 |
0 |
|
75 |
0.037 |
0.048 |
0.048 |
0.033 |
|
150 |
0.073 |
0.095 |
0.096 |
0.065 |
|
225 |
0.106 |
0.136 |
0.139 |
0.093 |
|
300 |
0.143 |
0.182 |
0.187 |
0.125 |
|
375 |
0.179 |
0.228 |
0.236 |
0.156 |
Part 1
The first task we faced in the analysis of our data was the development of a beam deflection formula for our loaded timber. This derivation was elementary compared to some of the homework problems we have tackled and so it proceeded smoothly. The derivation is attached as Appendix A. The end result was:

Part 2
The second issue we handled was the conversion of the pure mathematical Equation 1 to a Matlab function. We carried this out, in fact, two ways. See Appendix B for nondipoly.m (our first and slightly clunky method) and BeamF.m (our final and more powerful method) for these two routines.
After the development of the pertinent code, we plotted the function vs x/L for x/L=n/24 with n ranging from 0 to 24.
Part 3
In this section we attempted to find E. Instead of doing this, as one would expect, once, we carried out this task, using various methods, three different times.
Method 1
In this very first of many methods we found E using a relatively simple algorithm. We plotted--in an abstract sense, as will be explained shortly—pressure vs deformation for each of our four measuring stations in both the flat and upright positions. An example P-Delta plot is included in Appendix F. Once this had been done we located the slope of each of these graphs which, due to the nature of the situation, when stuck into the McCauley function we developed yields E. To carry out this calculation we needed the value of I for the beam. I, as shown in our textbook, is equivalent to the base times the height of the block cubed all over twelve. Thus when we stood our timber upright, this evaluates to 41.2 in4 and when the timber was laid flat, 17.5 in4.
In the above paragraph we mentioned that we qualified our statement that we plotted the data. This qualification was due to the fact that we discovered a Matlab routine that would allow us to carry out this analysis without any physical graphs. This function, polyfit(), generates a linear fit of the data when its degree is set to one. See Appendix B meth_one.m for pertinent Matlab code.
|
x: |
L/4 |
L/3 |
L/2 |
3L/4 |
|
Eflat (psi) |
1648500 |
1559200 |
1622800 |
1587600 |
|
Eup (psi) |
1485000 |
1316800 |
1483600 |
1473600 |
After we carried this out and found E’s for each of the four locations, we averaged them to get a single value for the entire beam. In this analysis we weighted each location equally. This choice was made to in order to have consistency with the analysis carried on later in Method 1 and Method 2. If we were solely carrying out our analysis this way we would weight the L/3 location much less than the other locations because at that location there was some crushing due to the application of the load that caused deflection separate from the actual bending of the beam. This crushing is possibly the cause of the relatively large variance of our 1559200 psi and 1316800 psi values for Eflat and Eup, respectively, at x = L/3.
The average we got for E (from finding the mean of the three E’s from the locations that were not where load was applied) were as follows:
Eflat = 1604500 psi Eup = 1439800 psi
Method 2
A MATLAB script was developed to determine the “best” flexural modulus for both the upright and flat beam configurations. Each individual data point was used to calculate an E value, and sum of the squared differences between each E and the “best” E was minimized. The location to minimize the squared differences was found to be the mean of the points as shown in a mathematical derivation in Appendix E.
The MATLAB script, which is contained in Appendix B as meth_two.m, was invoked as follows:
[a emeanvalflat] = meth_two([1/4;1/3;1/2;3/4],
flat_raw(:,1), flat_raw(:,2:5),17.5)
[a emeanvalup] = meth_two([1/4;1/3;1/2;3/4],
upright_raw(:,1), upright_raw(:,2:5),41.2)
The resulting E values for each location at each load for each beam orientation are given in the table below.
|
Method
2 Results |
|
|
|
|
|
Load(lb) |
1/4 Beam(psi) |
1/3 Beam **(psi) |
1/2 Beam(psi) |
3/4 Beam(psi) |
|
|
|
|
|
|
|
Flat
Configuration |
|
|
|
|
|
75 |
1586400 |
1469700 |
1584500 |
1490600 |
|
150 |
1608100 |
1485200 |
1584500 |
1513500 |
|
225 |
1661200 |
1556200 |
1641500 |
1586800 |
|
300 |
1641900 |
1550500 |
1626900 |
1574100 |
|
375 |
1639600 |
1547100 |
1611400 |
1576600 |
|
|
|
|
|
|
|
Upright
Configuration |
|
|
|
|
|
125 |
1340400 |
1109800 |
1416900 |
1451000 |
|
250 |
1432900 |
1203400 |
1435800 |
1451000 |
|
375 |
1449500 |
1248600 |
1455200 |
1451000 |
|
500 |
1470900 |
1280600 |
1475200 |
1466200 |
|
625 |
1473500 |
1307400 |
1479200 |
1475500 |
** Load was applied here, and displacement measured directly from the
testing machine.
The mean E values for each configuration are therefore:
Emeanflat =1576800 psi , Emeanup = 1393700 psi
Method 3
In this final method of determining the flexural modulus for
the wood, we determined a range of potential candidate values and calculated
the squares of the differences between calculated and ideal values of the
non-dimensional polynomial function for each candidate. We then selected the
candidate whose sum of the squares of the differences was least. Appendix C
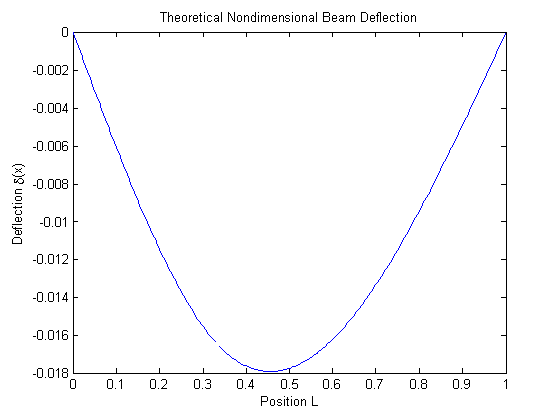
shows a graph of the upright data (in non-dimensional form, using the equation ![]() plotted alongside the
idealized non-dimensional polynomial function (code shown in Appendix B, nondimpoly.m and BeamF.m). The
code to automate this process is shown in Appendix B, meth_three.m. The calculated best
E values for each configuration are:
plotted alongside the
idealized non-dimensional polynomial function (code shown in Appendix B, nondimpoly.m and BeamF.m). The
code to automate this process is shown in Appendix B, meth_three.m. The calculated best
E values for each configuration are:
Eflat = 1591571 psi , Eup = 1417193 psi
Conclusion
The following table summarizes the values we found for the modulus of elasticity:
|
Method |
Eflat (psi) |
Eup (psi) |
|
Method 1 |
1604500 |
1439810 |
|
Method 2 |
1576800 |
1393700 |
|
Method 3 |
1591571 |
1417193 |
Some interesting points must be made here about the relation between location on the beam and the measured modulus of elasticity. As discussed earlier in our Method 1 analysis, the values observed for E at the location of load application were significantly less than the surrounding values. We hypothesize that this phenomenon is a result of crushing of the wood at this location. Because of this crushing the case can be made for reducing the importance of this point in our analysis or even discounting it entirely. We did not discount the E value at the load location in our determination of the “best” E values because it still seemed reasonable enough, especially considering we only had four data points to work with.
All things considered, we would furnish our timber purchaser with the average of the E values determined by method 3 for both of the upright and flat configurations. Method 3 seems to be the most robust procedure for determining an E value because it fits the data to the theoretical approximation best. The final E value we report is therefore 1504382 psi.
Ski Pole Buckling Analysis
Using Euler’s buckling formula for slender columns, we can calculate an approximate modulus of elasticity E for the ski pole under compression. The appropriate equations are given below.
![]()
Solving for E, we get 6685700 psi. This is reasonable compared to the beam, since the ski pole is made of a graphite/kevlar-epoxy composite, which is probably somewhat stiffer than a plain Douglas fir beam.
MATLAB Scripts
BeamF.m
function [f]=BeamF(XoL)
f = 1/9*XoL.^3 - 1/6*heaviside(XoL-1/3).*(XoL-1/3).^3
- 5/81.*XoL;
meth_one.m
function eslope = meth_one(xvals,pvals,deltavals,
I)
eslope
= 0;
L = 100;
for
j=1:size(xvals,1)
p=polyfit(deltavals(:,j),pvals,1);
eslope(j,1) = -nondimpoly(xvals(j,1)) * p(1,1) * L^3/I;
end;
meth_two.m
function [evals,emean] = meth_two(xvals,pvals,deltavals, I)
evals
= 0;
L = 100;
for
j=1:size(xvals,1)
for
k=1:size(pvals,1)
evals(k,j)
= -nondimpoly(xvals(j)) * pvals(k)/deltavals(k,j) * L^3/I;
end;
end;
numvalid = 0;
emean
= 0;
for j=1:k
if(mean(evals(j,:)) >= 0) %detects whether mean is
emean = emean + mean(evals(j,:));
numvalid = numvalid + 1;
end;
end;
emean
= emean / numvalid;
meth_three.m
function [E3best minsum] = meth_three(raw,
nondim)
minsum = -1;
Ebest = 0;
for
Etest = 900000:1:1500000
defEst
= - Etest .* 41.2 .* raw(6,2:5) ./ (625 * 100^3);
diffs
= defEst - nondim;
diffsqd
= diffs .^ 2;
diffsum
= sum(diffsqd);
if (minsum == -1)
minsum
= diffsum;
E3best = Etest;
elseif
(diffsum < minsum)
minsum
= diffsum;
E3best = Etest;
end
end
nondimpoly.m
function retval = nondimpoly(x_L)
retval
= 0;
for i=1:size(x_L,1)
if (x_L(i) > 0)
retval(i)
= retval(i) + (1/9)*x_L(i)^3;
end;
if (x_L(i) > 1/3)
retval(i)
= retval(i) + (-1/6)*(x_L(i)-1/3)^3;
end;
if (x_L(i) > 0)
retval(i)
= retval(i) + (-5/81)*x_L(i);
end;
end;